Section 14.1 Setup
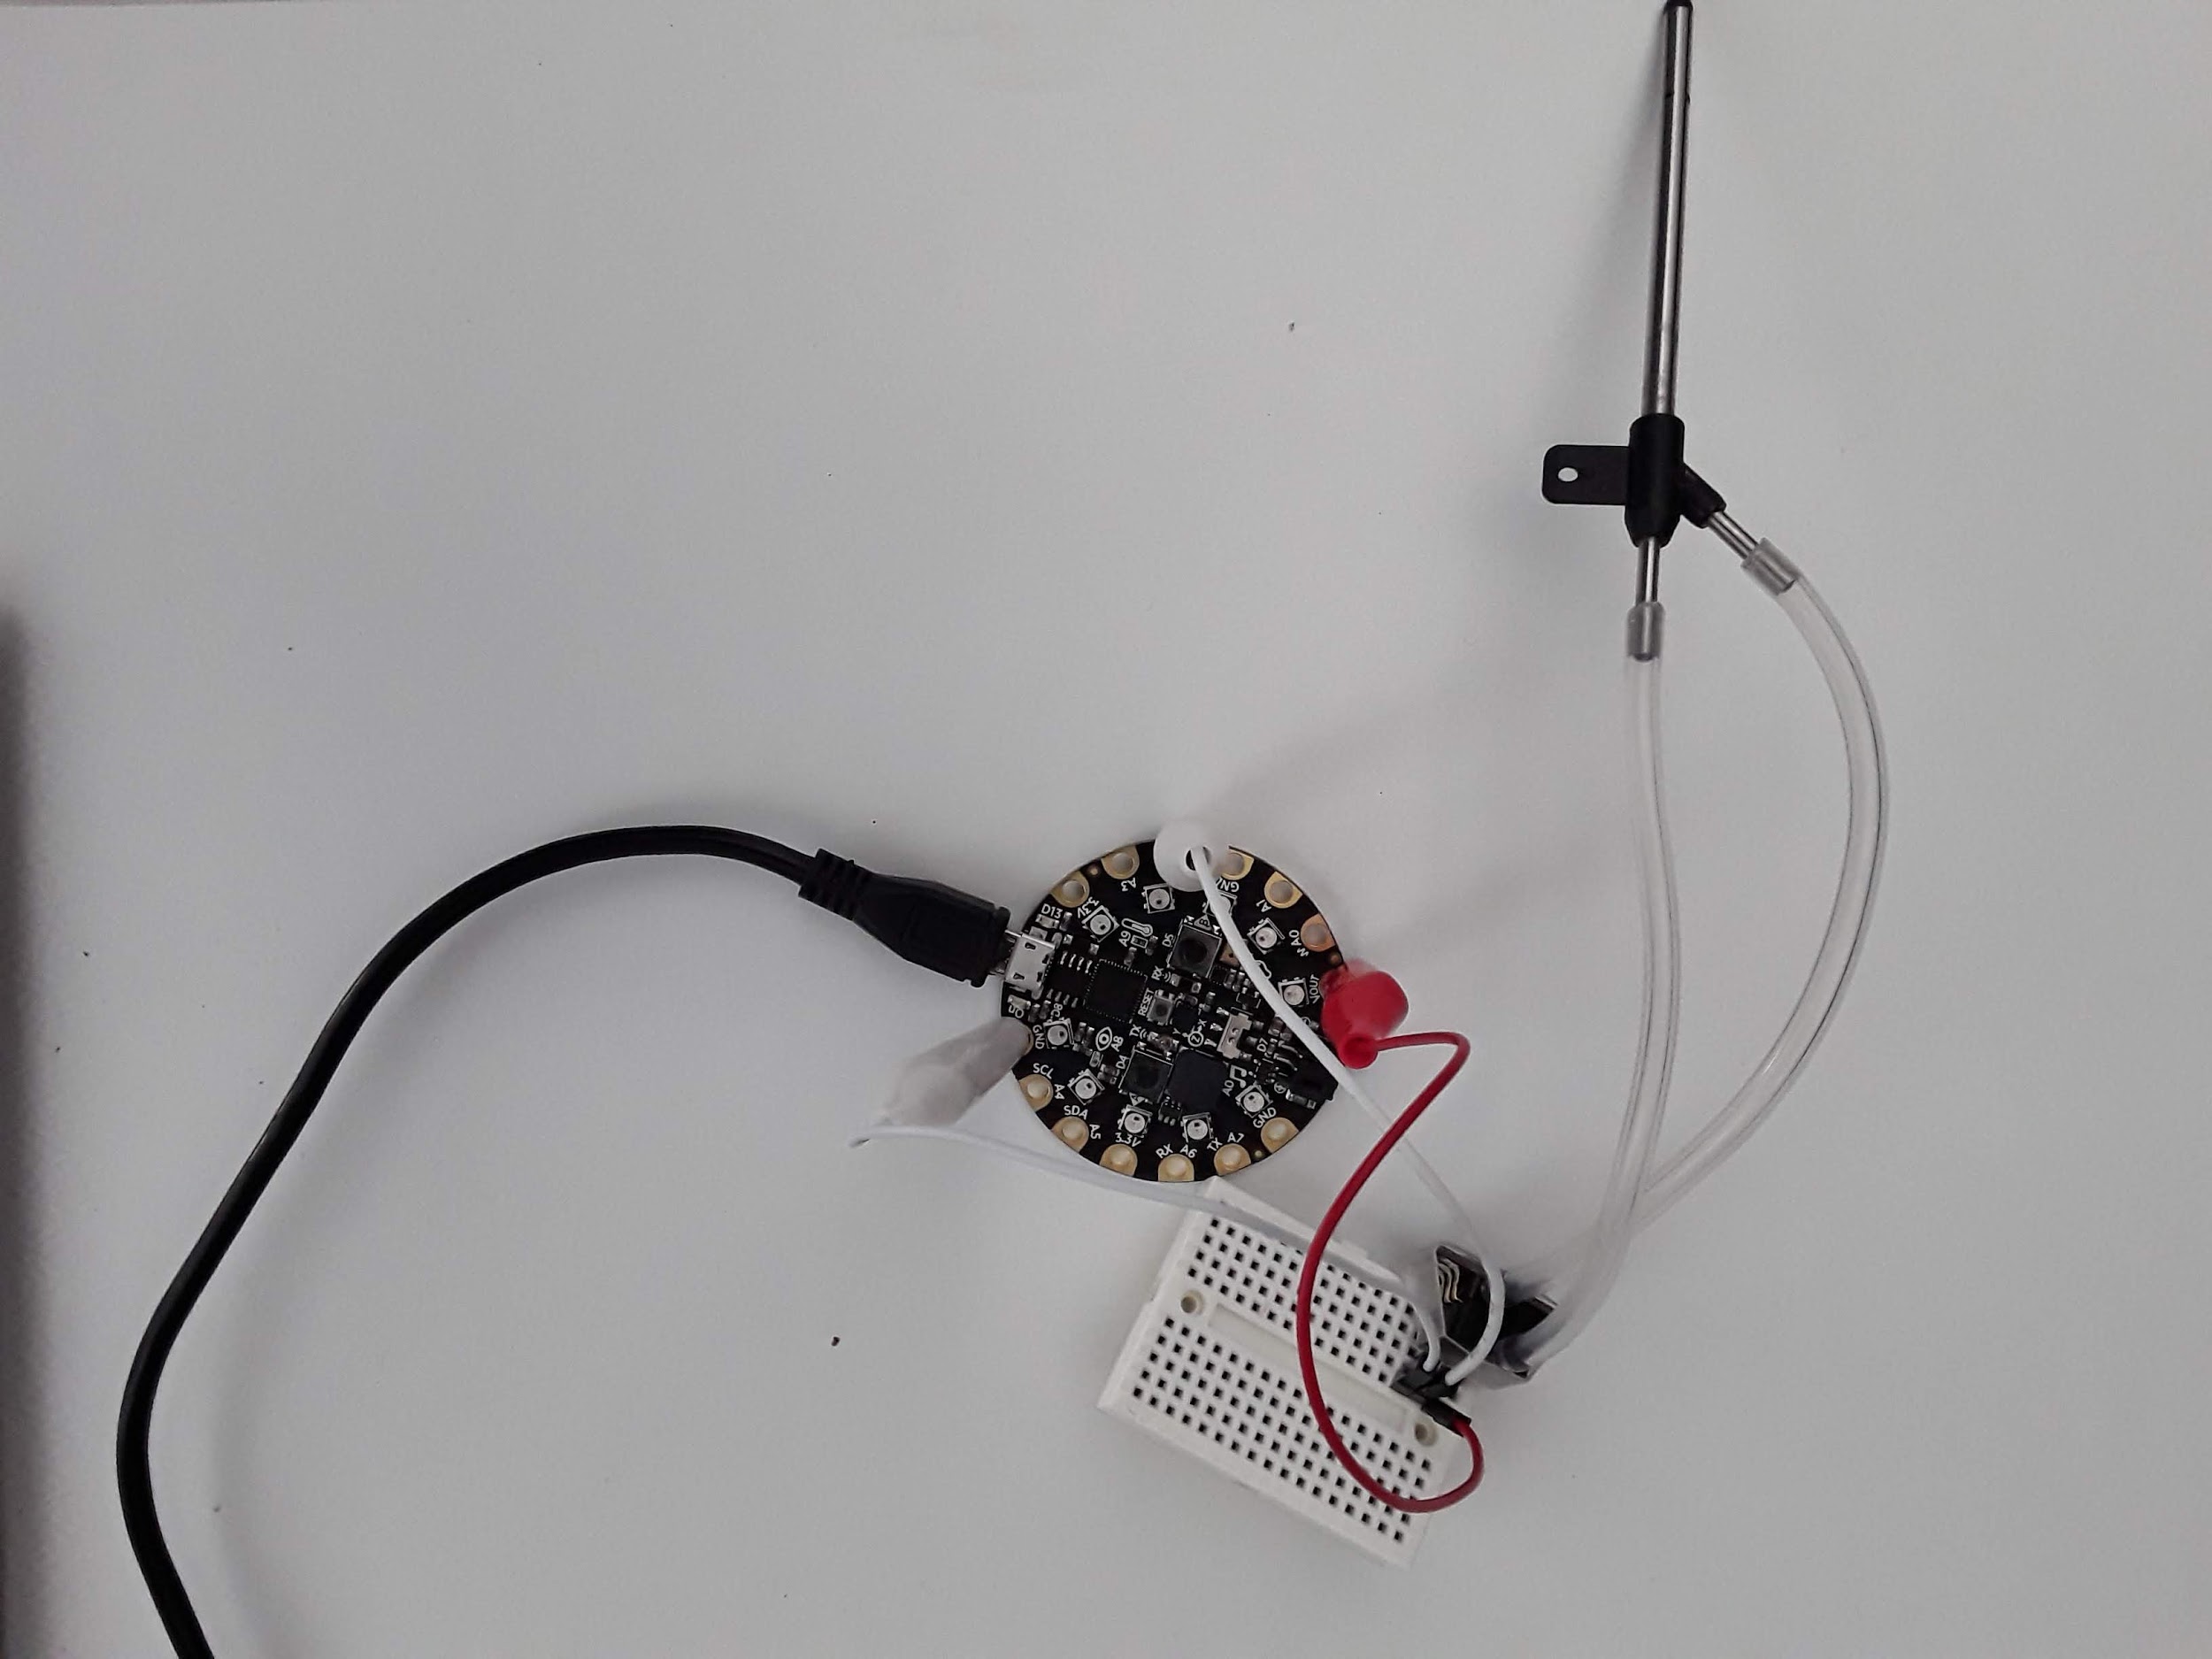
To complete this lab, I chose pin A2 as shown in the Figure below.
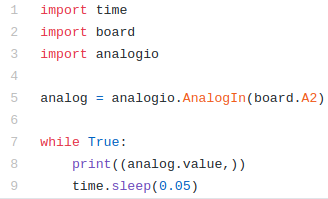
At that point it’s very simple to just print the analog signal in bits to Serial. I’ve done this below. The code is the same analog code that we’ve used in the past[33].
The goal of the experiment is to take pitot probe data for 15 seconds with no wind, then 15 seconds of data with a fan on and then 15 seconds of no wind data. You’ll need to use one of the datalogging methods (See Chapter 9) to log both time and pitot probe analog value. Once you have that data, import the data on your desktop computer and convert the signal to windspeed as explained above. Using your data, create a plot of windspeed with time on the x-axis and windspeed on the y-axis. Some steps that might help you as you complete this project. First, have Mu plot the voltage coming from the pitot probe. If you’ve done everything right it will not be zero. The data sheet says there’s an offset voltage of 2.5V so you will hopefully get something around 50,000 when you don’t blow into the pitot probe. 50,000 multiplied by 3.3/\(2^{16}\) is around 2.5V. Make a note of that average value you get so you can subtract it off later. Once you’ve verified you’re reading the pitot probe correctly, blow into the pitot probe and using the Plotter or Serial, verify that the analog signal increases. If the signal decreases, it means the pressure taps on the pressure transducer are backwards and you need to flip them. Either that or just flip the sign in your plotting routine on your computer but flipping the tubes might be easier for you. Hopefully when you do this lab you will get some data that looks like this. In this Figure you’ll see that when the fan wasn’t running the signal was something around 49,800 which is fine. It means your bias is around 2.5 volts. Every pitot probe and circuit will be different. You can then convert this signal to voltage then and then pressure and then finally wind speed.
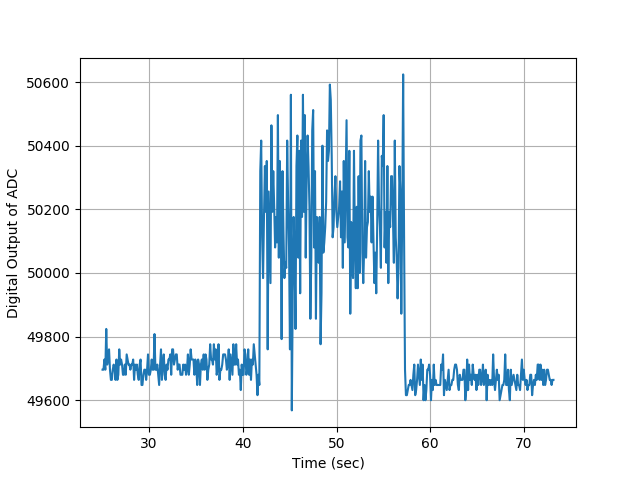
The code to accomplish this is relatively simple and a portion of the code is shown below. You’ll see that when I subtracted the bias from the voltage I also zeroed out any negative values. That is, any delta voltage less than zero was set to zero. A couple of things about this chart. The data from the pitot probe is super noisy which means attaching a complementary filter is probably a good idea provided you don’t over filter the signal and run into aliasing issues (See Section 21.3). You can see that I implemented an offline complementary filter and plotted it in the orange line which helps the noise issue quite a bit. You’ll also notice that the noise is about 2 m/s. It turns out that pitot probes are actually not very accurate lower than about 2 m/s. They would be great for an airplane or you driving down the highway but they wouldn’t be very good to take wind data outside on a calm day.

