Section 9.8 Plotting Logged Data
Alright so there you have it. I have explained 4 methods to datalogging. Here are the methods again in summary.
-
Print data to Serial and copy and paste
-
Use the Keyboard module to save data to a spreadsheet
-
Access the storage of your CPX and write data to a text file on the CPX
-
Send data wirelessly to a Cell Phone using Bluetooth - CPB Only (See Chapter 10)
All methods will work but some will obviously have their pros and cons. I suggest you get comfortable with 1 method and use that for the remainder of the semester. Whatever option you choose though will provide you with a data file that you can open on your desktop computer to plot. The simplest way to import data is by using the loadtxt function from the module numpy. Here is some very simple code to plot data from a text file.
When you plot make sure your Test_Data.txt file is in the same folder as your plotting script in Thonny or Spyder. Here’s my example code (this code is not on Github but you only need 3 or 4 lines of code to plot).
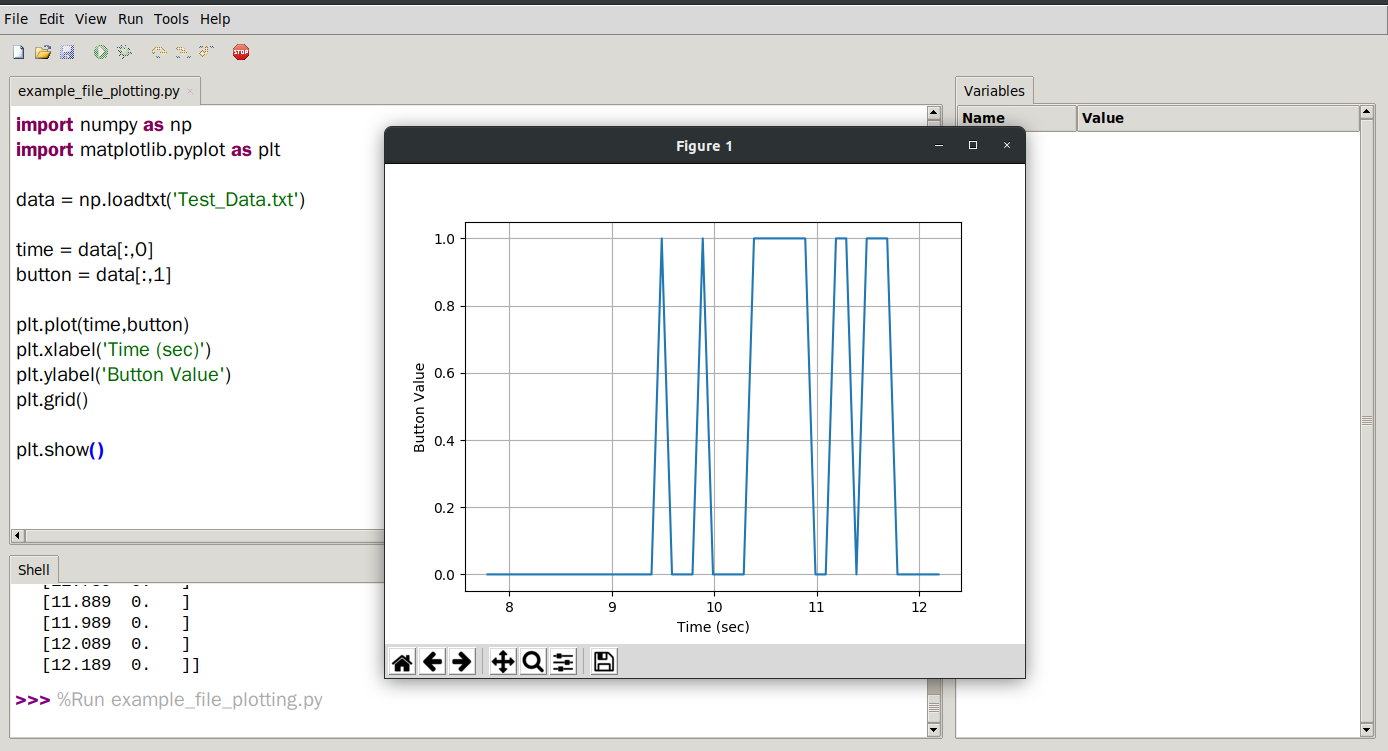
In this example lines 1 and 2 import numpy and matplotlib. Line 4 imports data from the Test_Data.txt file and then 6 and 7 save the first and second columns into time and button. The remaining lines plot the data and create x and y labels as well as a grid. Hopefully now you are well versed in taking data and plotting on your desktop computer.
