Section 18.1 Taking Data
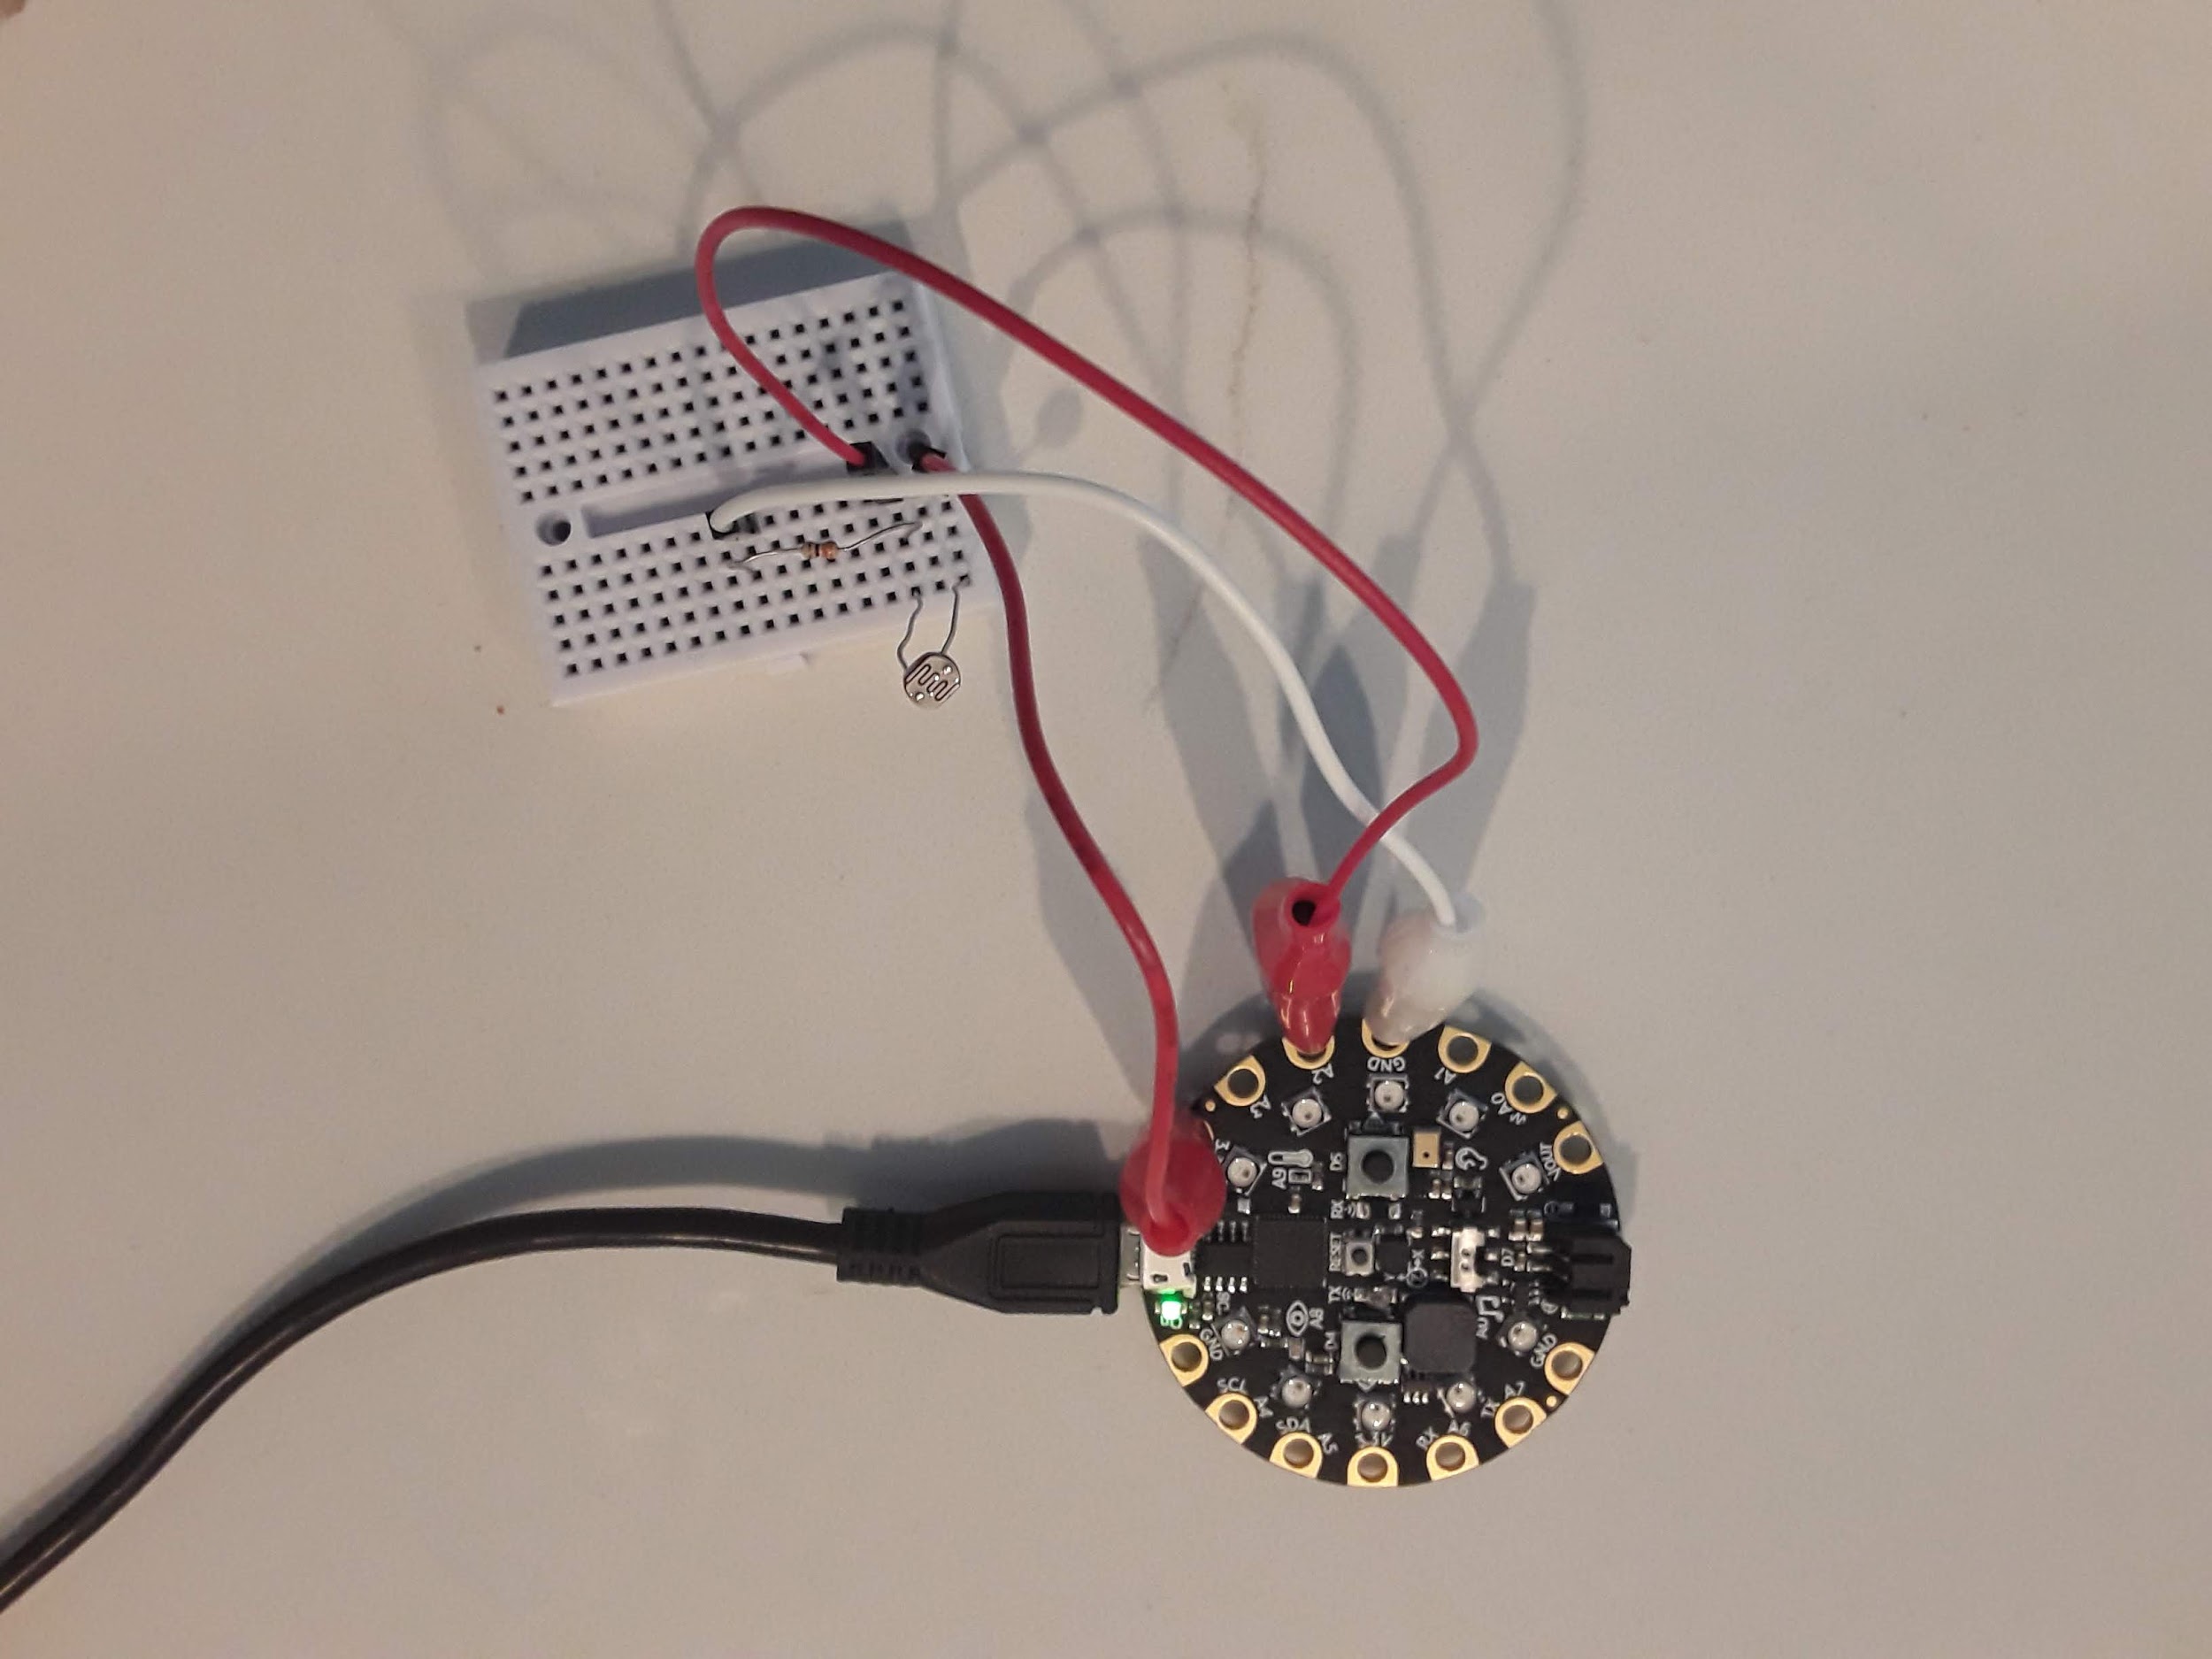
For this lab you need to wire up the circuit, take data at the low and high value of the photocell by covering the sensor with your finger and then shining a light on it and plotting the entire data set on your desktop computer. The wiring diagram was already presented and when I did the lab my example circuit is shown below. An alligator clip is connected to 3.3V on the CPX and the other end is connected to either end of the photocell. The photocell is then in series with a resistor and the other end of the resistor is connected to GND via another alligator clip. Finally, another alligator clip from pin A2 is plugged into the same row on the breadboard as the resistor and photocell. Again any \(\Omega\) value will do for the resistor. I used a 10k resistor but you can use a 1k or even a 330 resistor and it will work just fine. The only thing that will change is the range of voltages you get across the photocell. Recall that the equations for the photocell in a voltage divider are in Subsection 15.1.1.
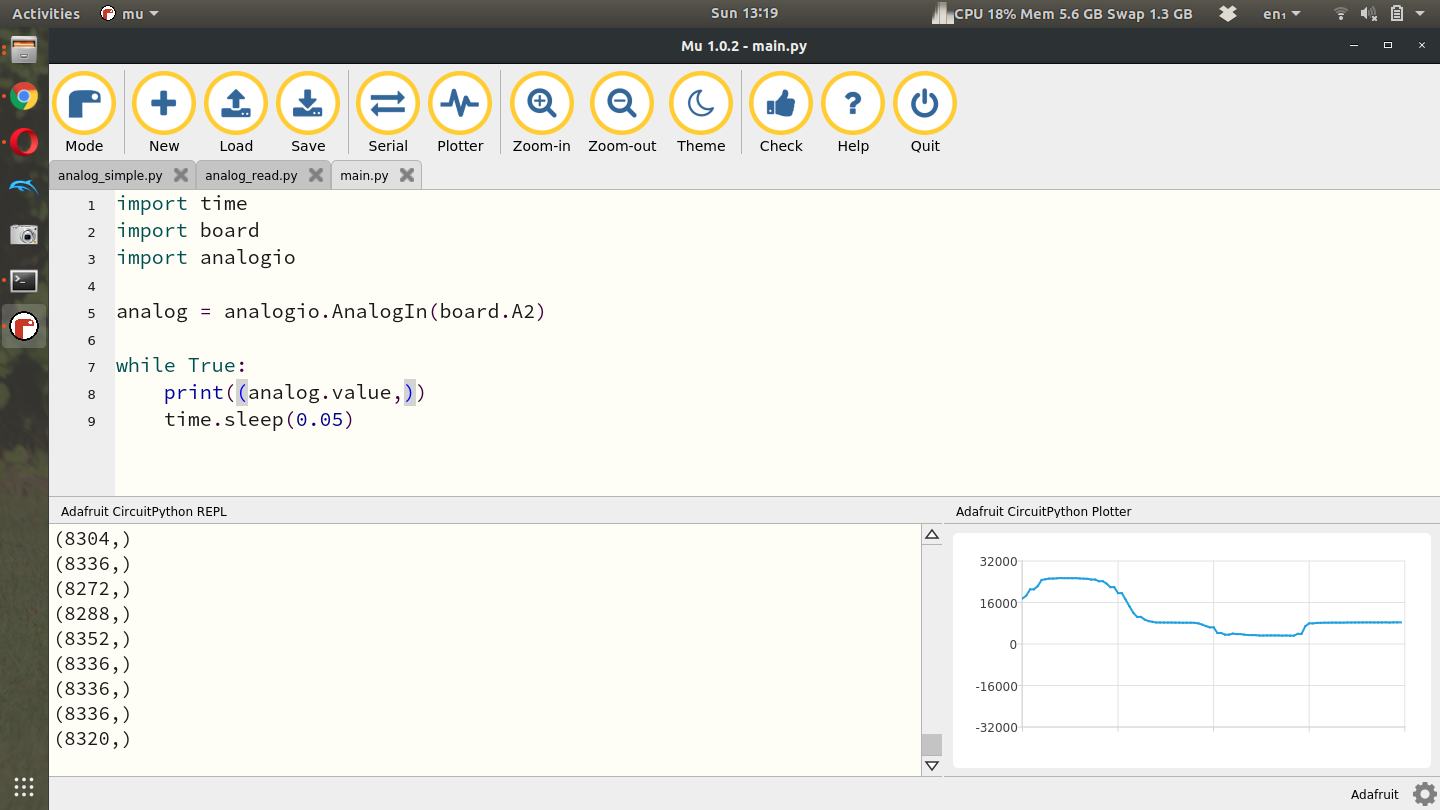
Once you have the circuit wired properly you can use the same code as the potentiometer lab[33]. The example screenshot below shows the analog signal below showing a high spike where I placed a flashlight over the photocell and then a low spot where I covered the photocell with my finger. Remember that you can use any Analog pin on the CPX provided you change line 5 to the same pin.
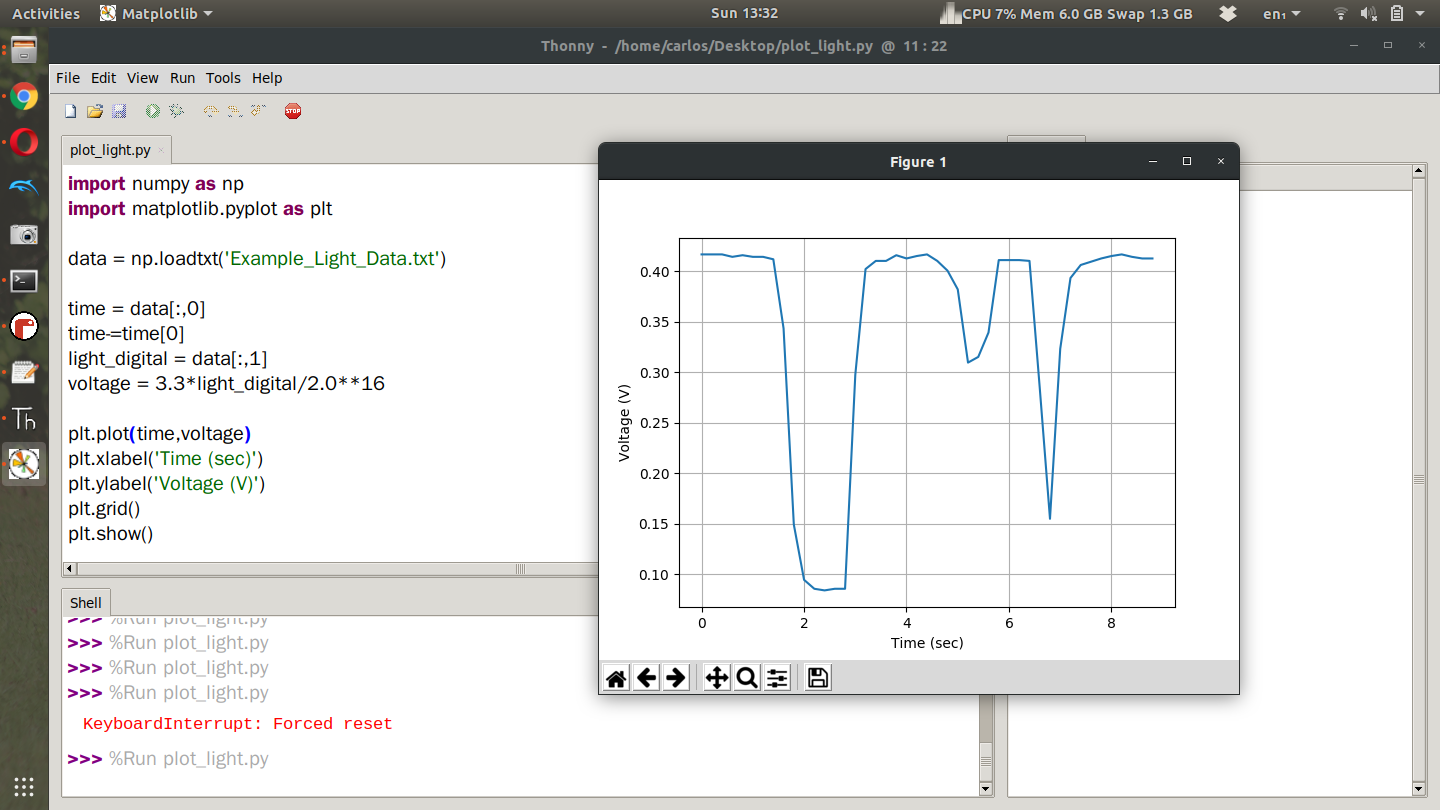
Once you’ve gotten some example data you can plot the result as you did for the potentiometer lab. Here’s what your plot may look like.