Section 23.5 Data from a Rocket Launch
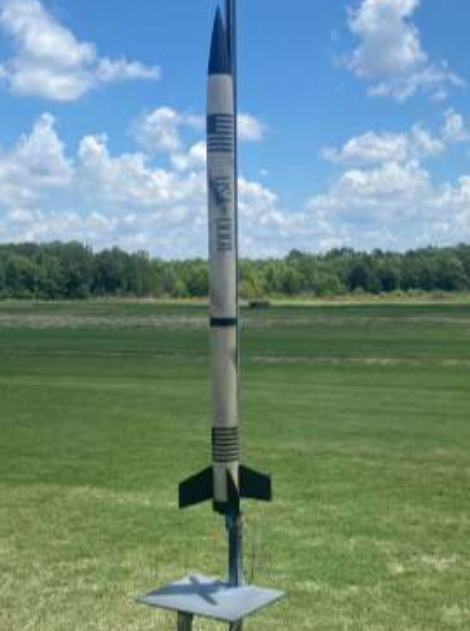
My students have placed this entire data logger into a rocket and launched it. The figure below shows the rocket on the launch pad in Samson,AL.
The datalogger itself is attached to a piece of wood that is called a sled and then placed into the rocket prior to launch.
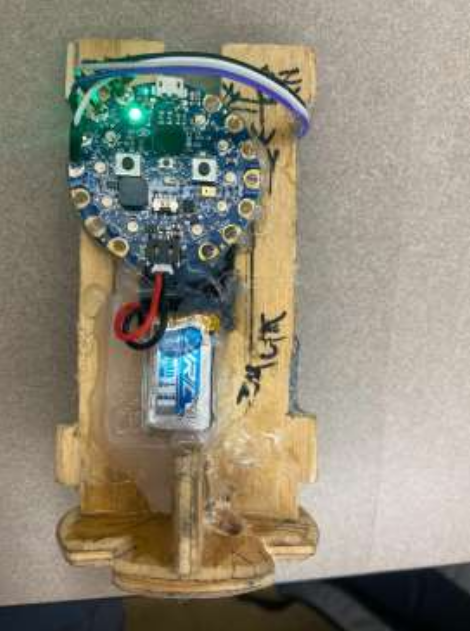
In the figure above the small gray piece below the CPB is a small 1S Lipo battery and the LPS22 is on the other side of the sled. The figure below shows pressure as a function of time.
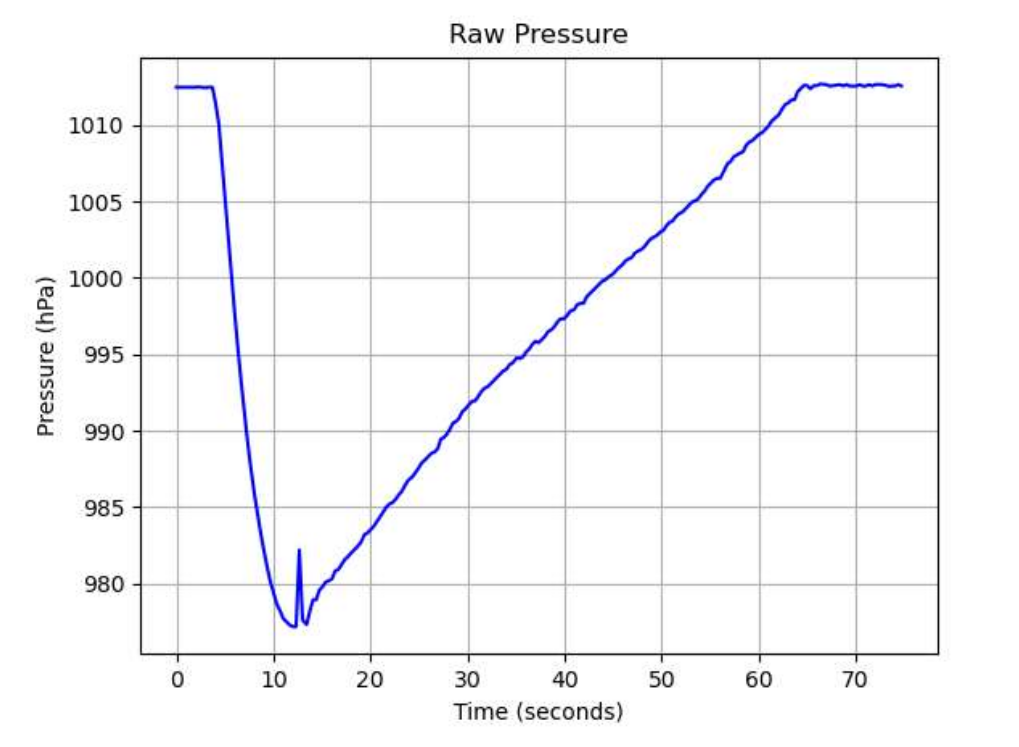
It’s clear from the data that pressure drops as the flight continues showing the boost phase of the rocket. There is a small oscillation near the apogee of the flight. This is due to the delay charge to blow the nose cone off the rocket body to deploy the parachute. The pressure sensor is measuring local atmospheric pressure. So if there is a small explosion inside the rocket to deploy the parachute, the data will show a slight oscillation.
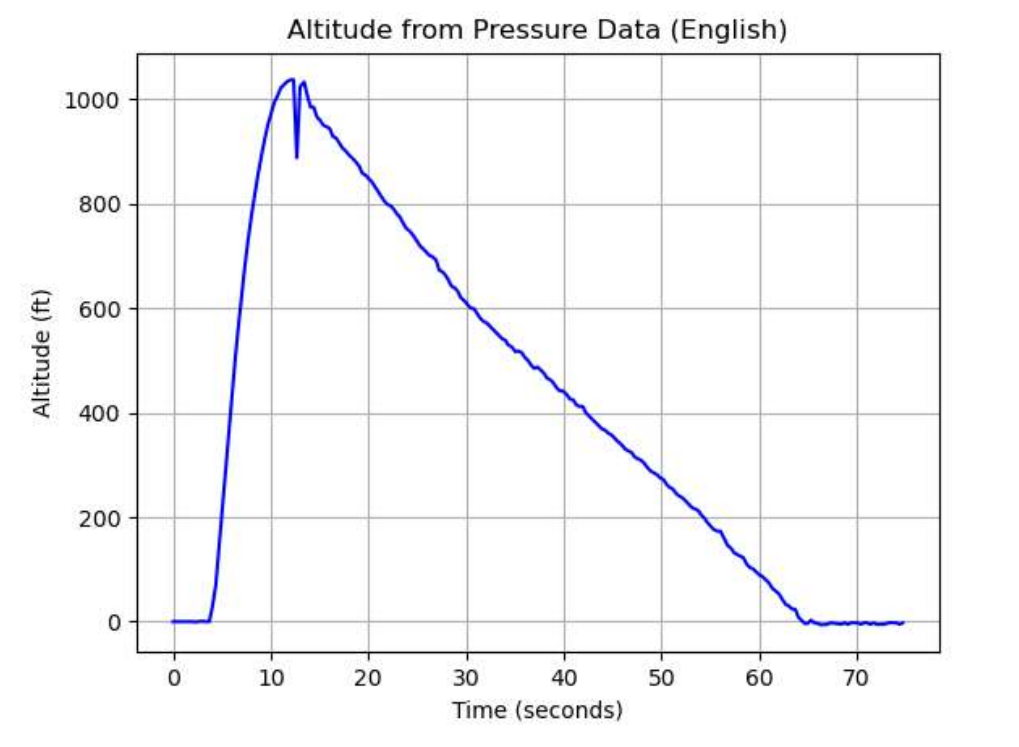
The figure above shows the pressure data converted to altitude using the equation shown above. Note that in order to get an altitude of zero at time (t=0) it is important to set \(p_0\) equal to the pressure at time (t=0). This way the altitude will be zero at the start of the flight and will increase as the rocket goes up. Again the altitude plot shows a small oscillation in altitude which isn’t true but indicative of the explosion to deploy the parachute.
