Section 5.1 Python IDEs
So which IDE is the best and which is recommended? Two IDEs are recommended for Python. They are explained in the next two sections. Either one is totally fine. If you just Google “Python download” you will find a humongous list of editors (Scratch, Anaconda, Canopy, Eclipse, PyDev, etc). It’s easy to get lost when searching for something so broad. Again, just using Spyder or Thonny.
Subsection 5.1.1 Thonny
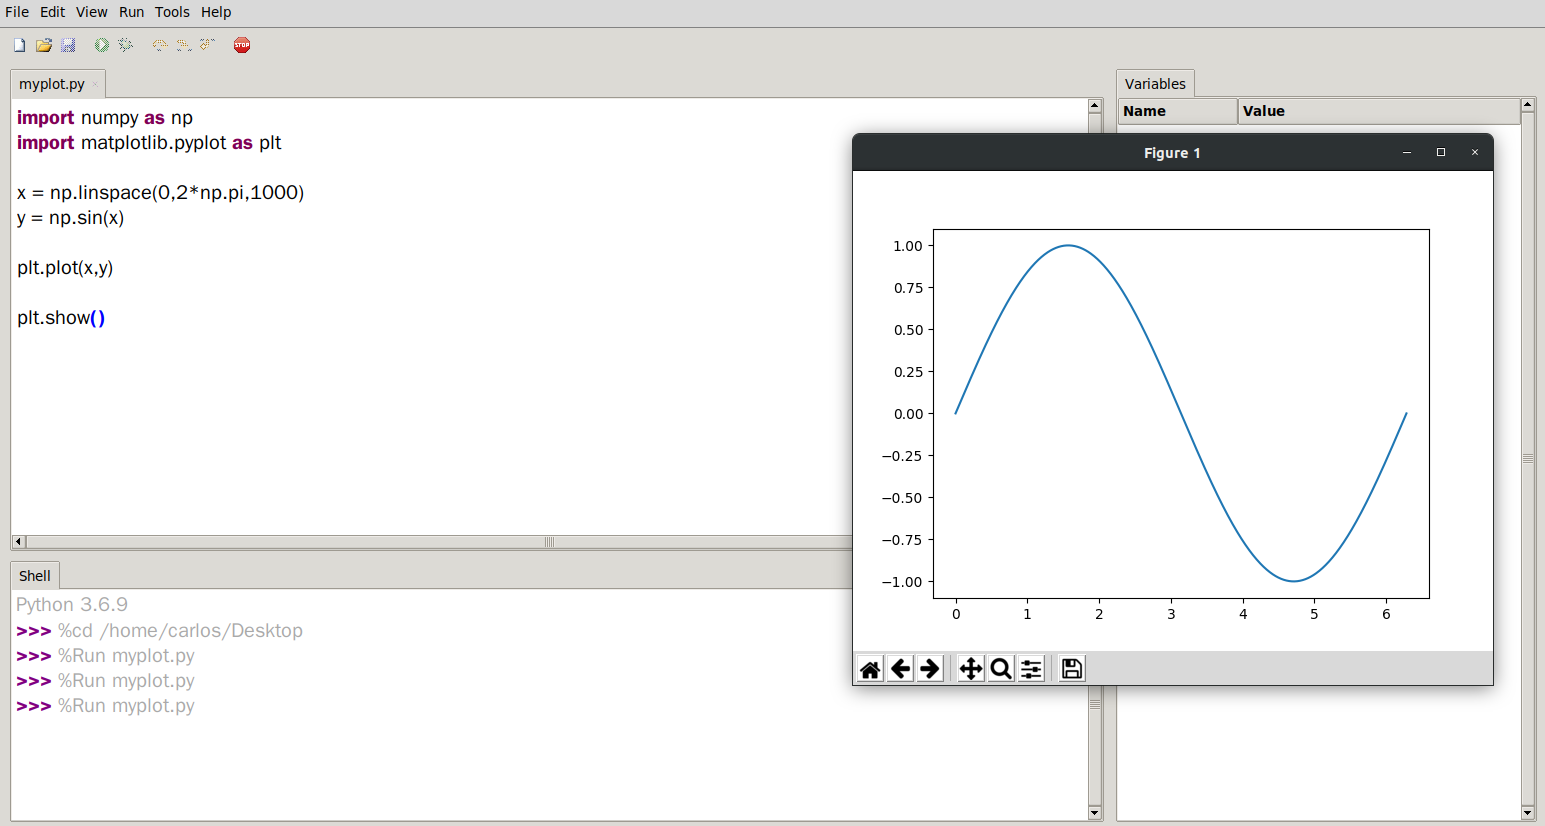
Thonny - https://thonny.org[52] is a great, easy, simple and lightweight IDE that has been around for years. Note that there is a 32 bit and 64 bit version. Which one is necessary? Well that depends on how many bits the computer has. This is a great thing to Google. Type the following: "do I have a 32 bit or 64 bit computer" into Google. It’s more than likely that everyone reading this has a 64 bit computer but it’s always a good idea to check. Learning the difference between 32 and 64 bit computers is the topic of another chapter (Chapter 13). The figure below is a screenshot of what Thonny looks like with a sine graph plotted.
Subsection 5.1.2 Spyder
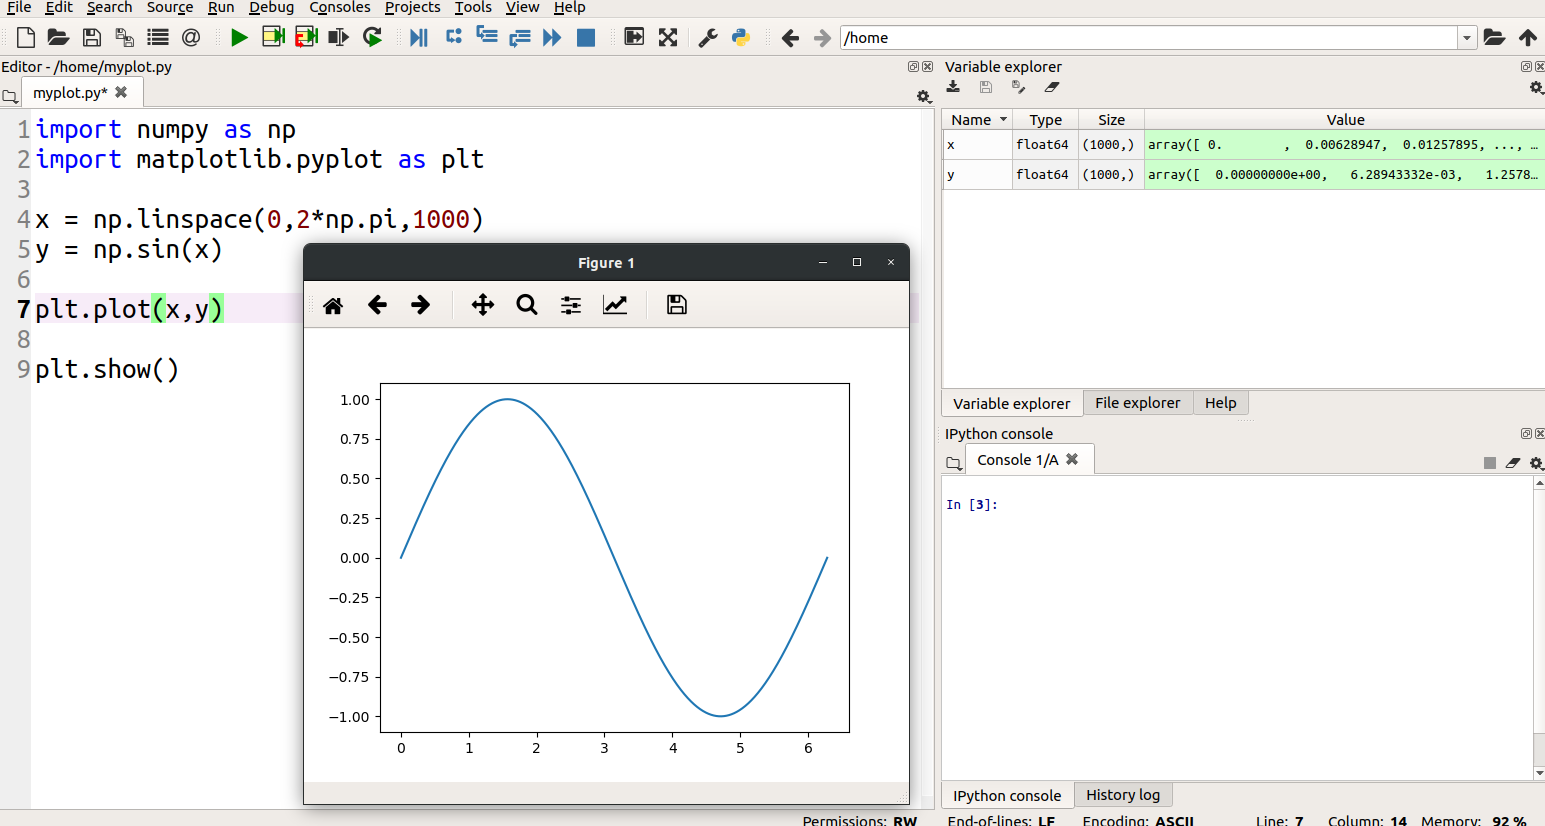
Spyder - https://www.spyder-ide.org/[53] is a powerful IDE that is widely used in the scientific Python community. The figure below is a screenshot of what Spyder looks like with a sine graph plotted.
Subsection 5.1.3 Setting up the IDE
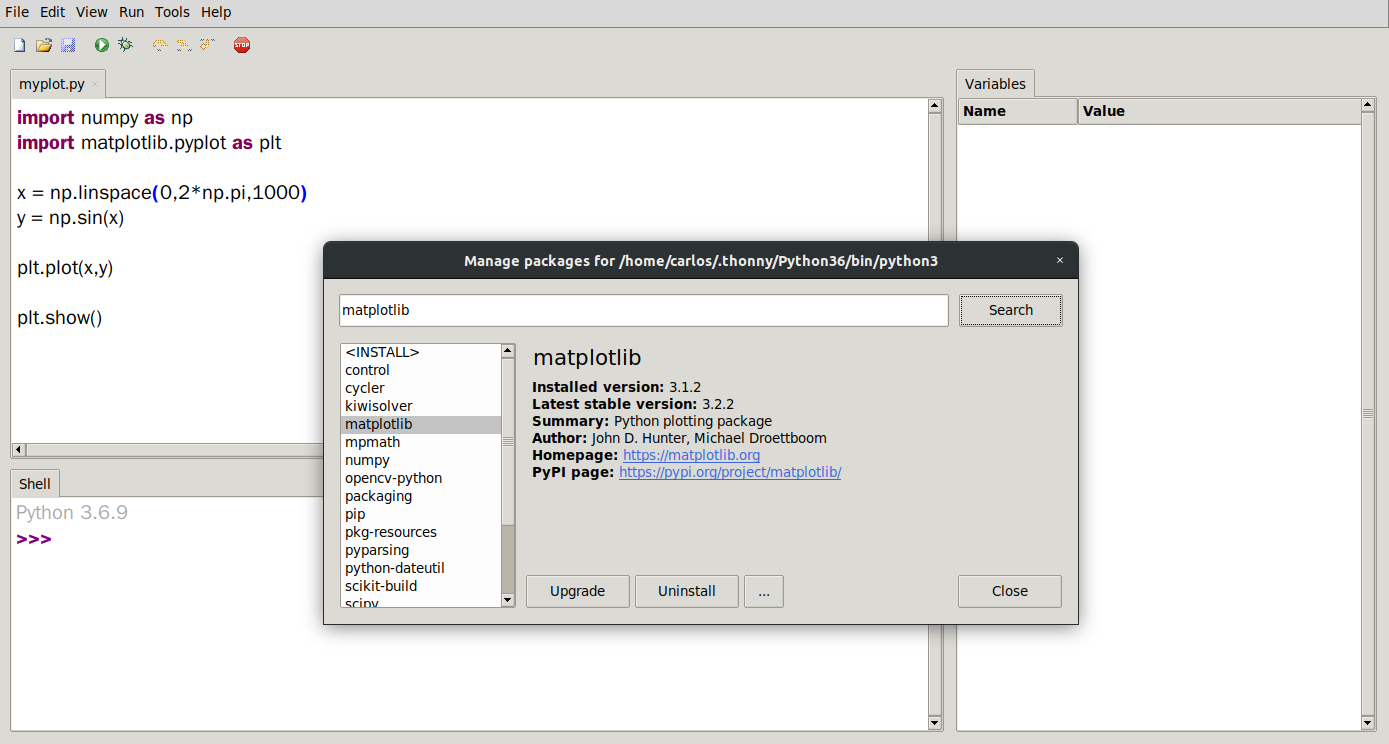
Once Thonny or Spyder is installed, numpy and matplotlib are necessary modules within Python that allow Python to do some extra things like numerical computation with Python (numpy) and Matlab style Plotting libraries (matplotlib). How to install modules in Youtube is in the Extra Help section Section 5.3; however, the simple way is to head over to Tools>Manage Packages in Thonny. The image below shows that version 3.1.2 is already installed but can be upgraded to 3.2.2
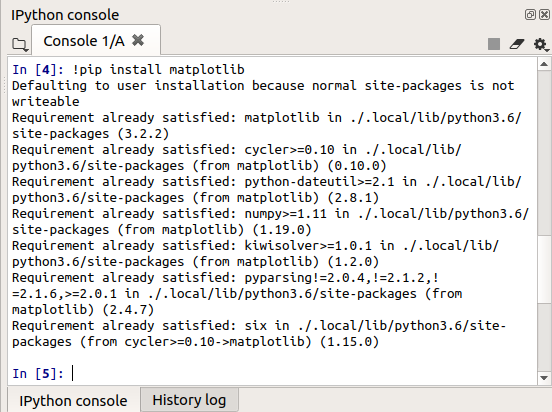
If numpy or matplotlib is not already included in Spyder then type the following into the Python Console in the lower right hand corner of Spyder which is called the IPython console.
!pip install matplotlib
If that doesn’t work try
!pip3 install matplotlib
The output example below shows that matplotlib is already installed installed as it says “requirement already satisfied”. Assuming there is a valid internet connection it will install the necessary module.
Subsection 5.1.4 Scripting
Once numpy and matplotlib is installed it’s time to make a plot. Here is a simple example.
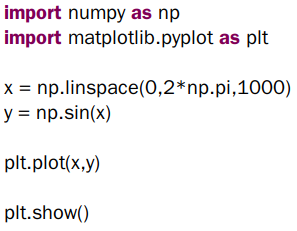
The code above will plot a sine wave from 0 to 2pi. The two lines at the top are importing the numpy and matplotlib modules you installed earlier. When they are imported we give them shorter names so it’s easier to reference them so numpy will now be called np and matplotlib.pyplot will be called plt. The next two lines then create a vector “x” from 0 to 2pi using 1000 data points. The next line then uses the sine function to create the vector “y”. Finally “x” and “y” are plotted and the figure is instructed to pop up on your screen using the show() function.
