Section 5.2 Other Plotting Tools
Subsection 5.2.1 Google Colab
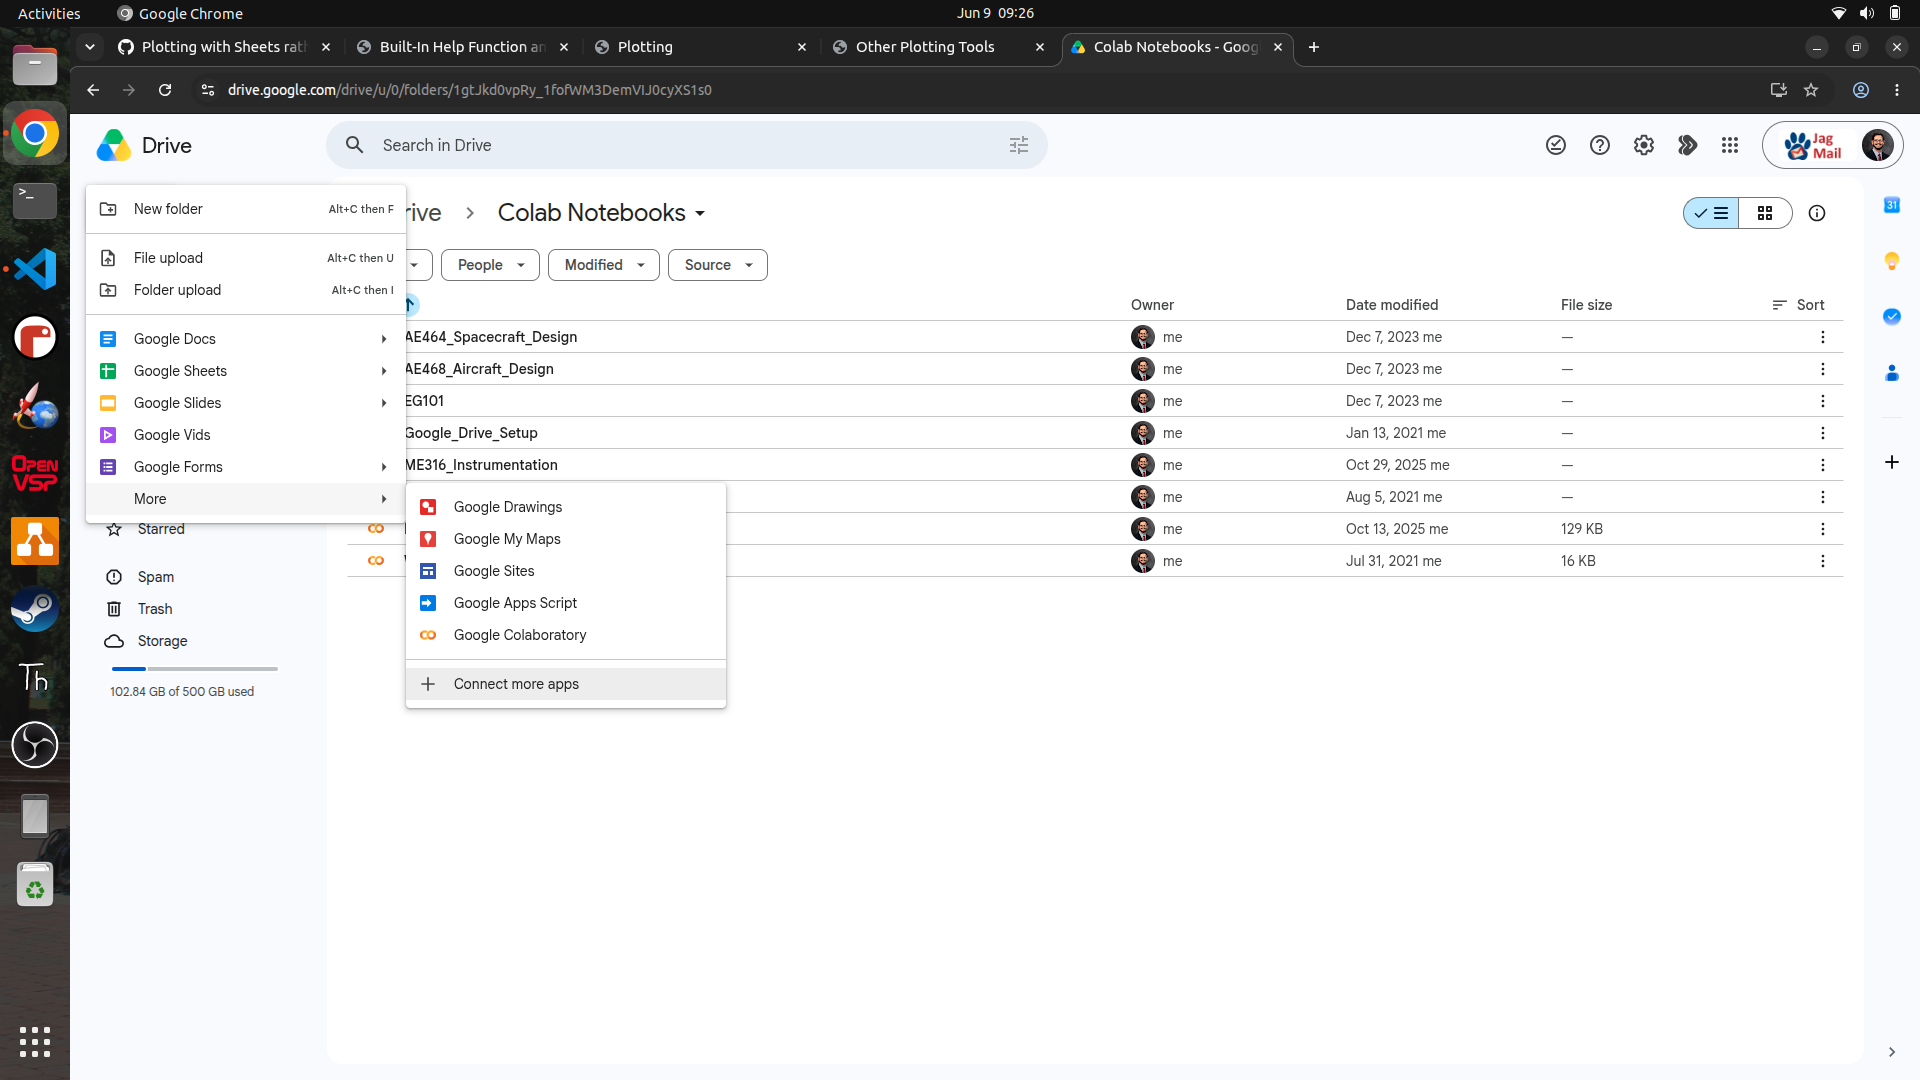
It is possible to use Google Colab[54] to collaborate on Python projects, run in the cloud/browser. In order to get Colab to work a Google account is necessary. Colab is a great tool for collaborating on Python projects and sharing code with others. It also has the advantage of running in the cloud so it can be accessed from any device with an internet connection. Although it’s possible to head directly to the Colab website, it is recommended to open Colab through Google Drive. To do that simply open Google Drive>+New>More>Connect more apps and then install Google Colab as shown in the figure below.
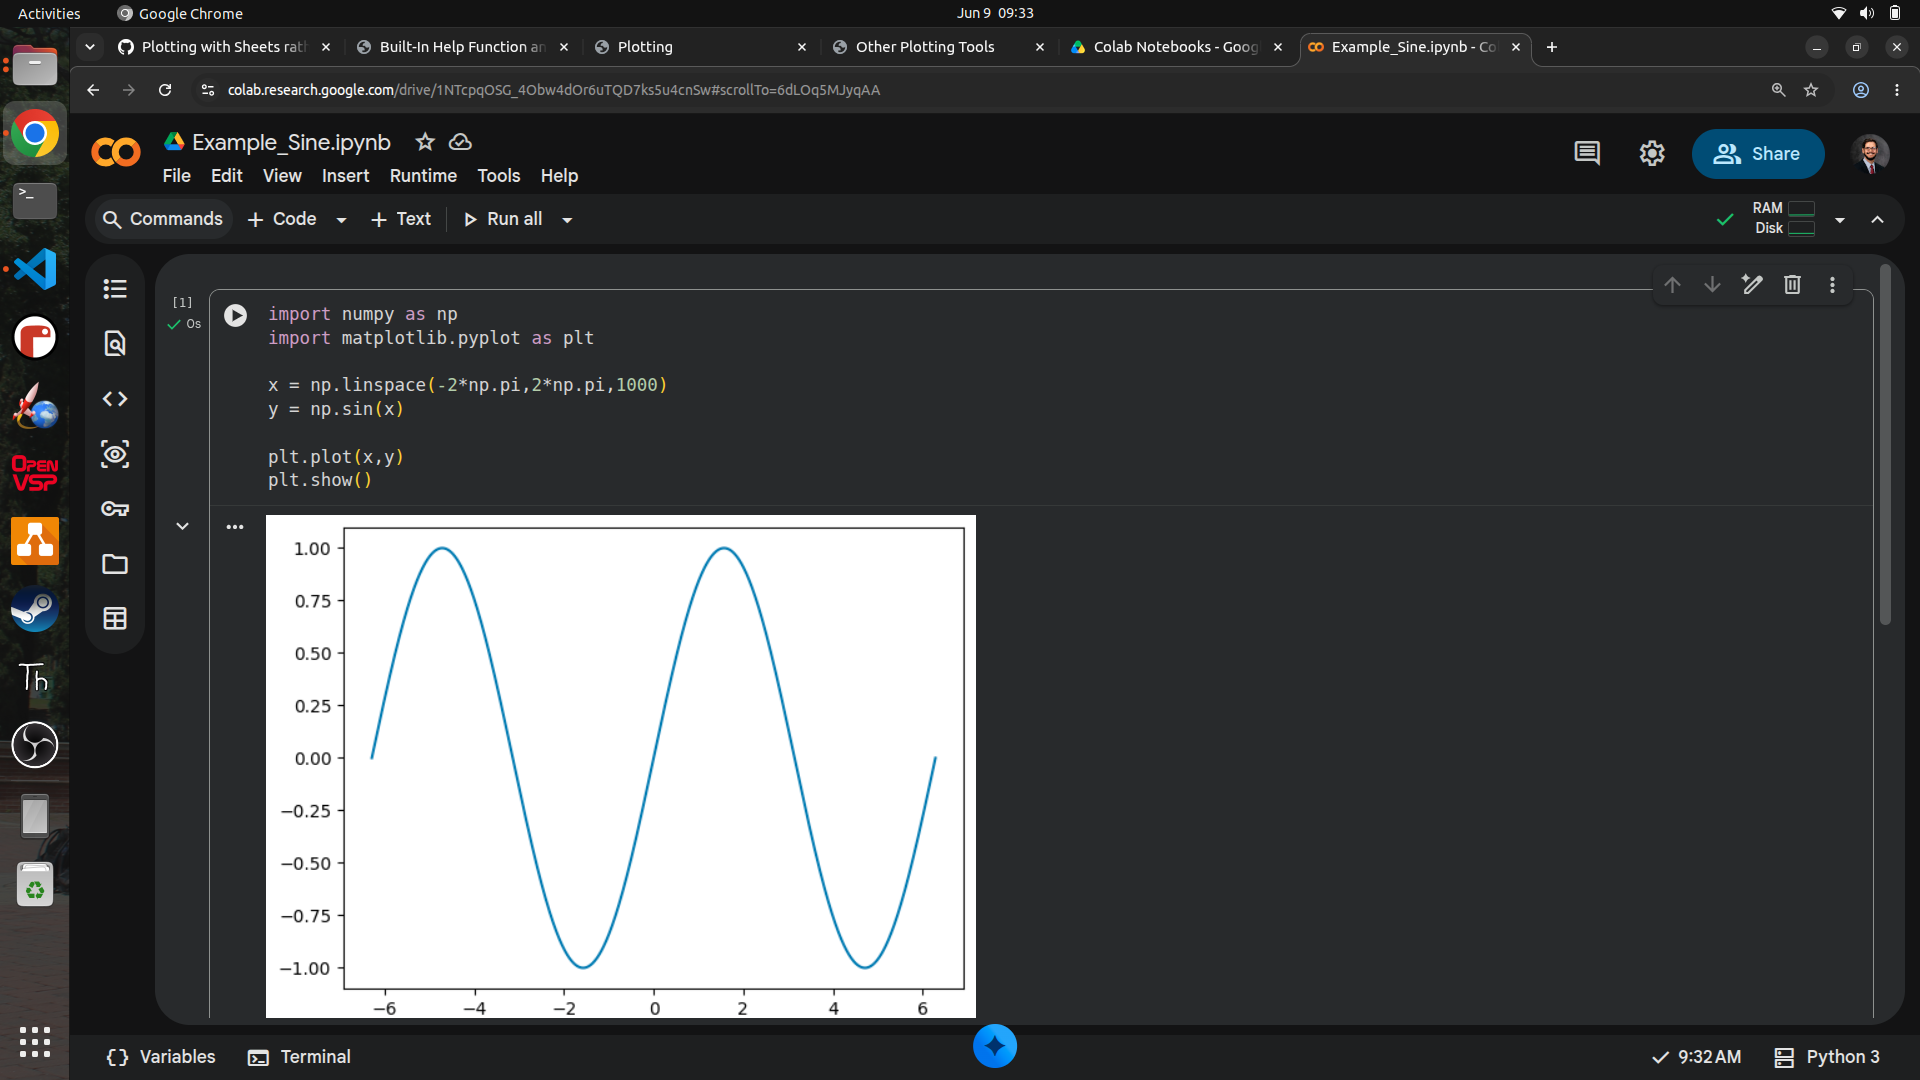
Once that’s done it will be possible to open a new Google Colab notebook. The figure below is a screenshot of what Colab looks like with a sine graph plotted. The other benefit to using Google Colab is that Gemini is imbedded into Google Colab for easy AI integration.
Subsection 5.2.2 Octave
Octave is very similar to MATLAB but free. The only major downside is that Octave is much slower and doesn’t have a lot of extra utilities that MATLAB does. However, if it’s not possible to get MATLAB, Octave is a great alternative. The figure below is a screenshot of what Octave looks like with a sine graph plotted.
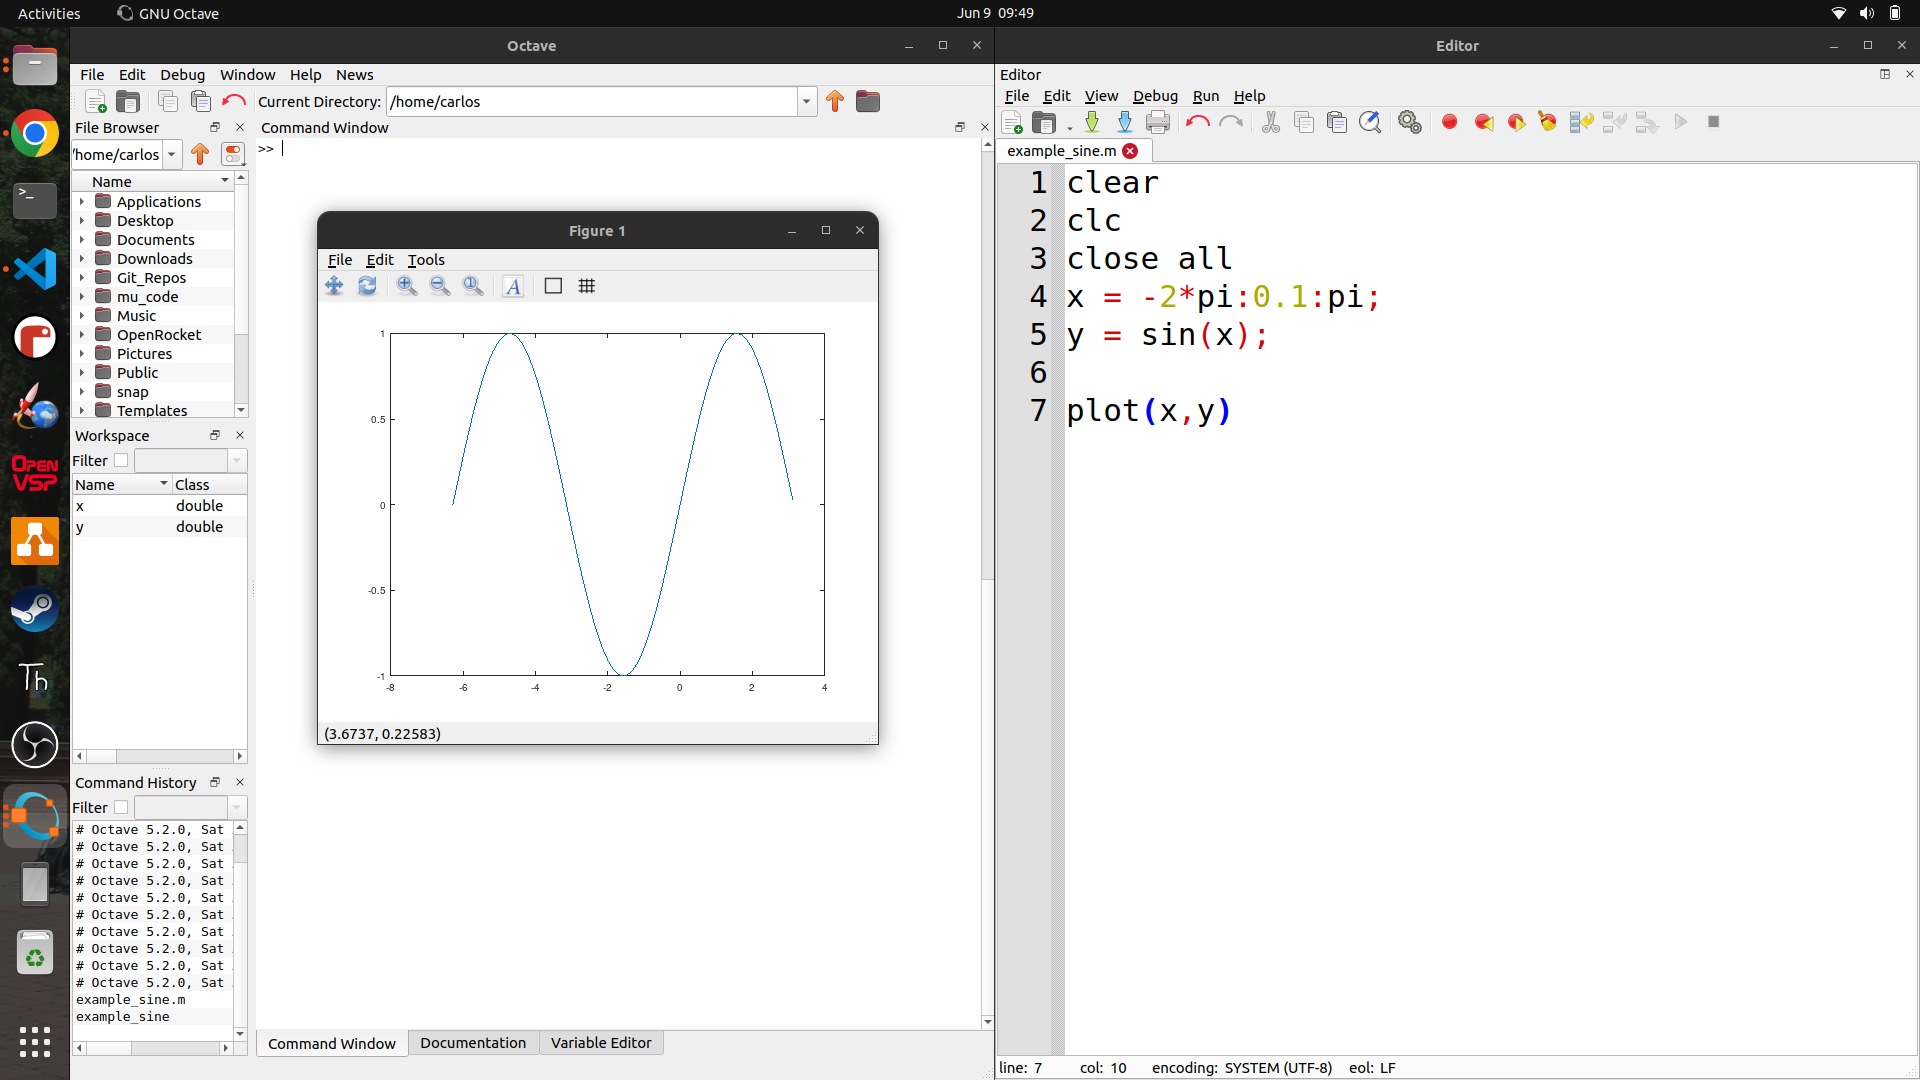
Notice that the syntax is very similar to Python but slightly different. Deep diving into programming is not the focus of this class but anyone wanting to learn more about programming in Python or Octave can find plenty of resources online. The best way to learn is to just start writing code and then Google any errors that come up. The error messages are usually pretty descriptive and will lead to the answer. Furthermore, with the spawn of Generative AI many students often code better than ever before with a few prompts into any AI tool like Gemini, Copilot, Grok or ChatGPT. Also, the extra help section (xref ref="extra-help"/>) has many youtube videos on how to program if videos are preferred to AI or text.
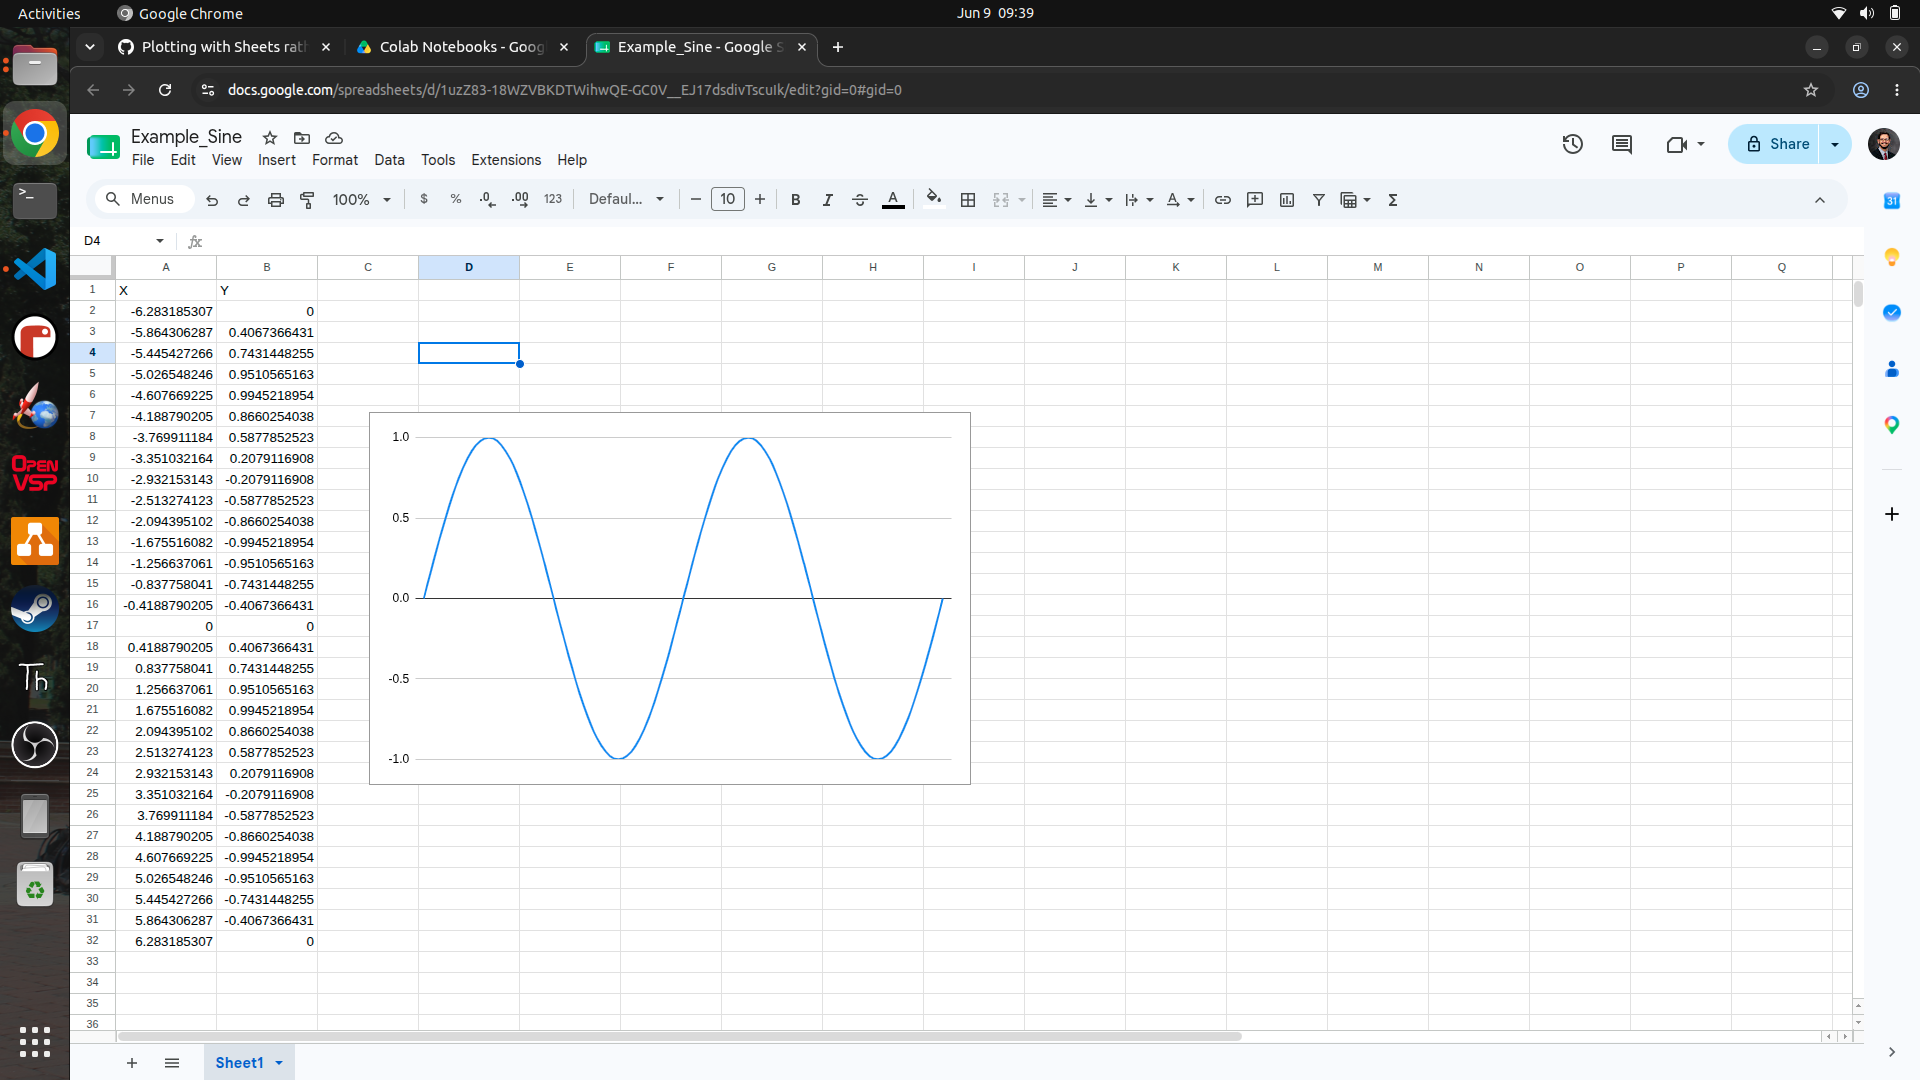
Subsection 5.2.3 Google Sheets
Google Sheets is typically already installed in all browsers again provided a Google account is created first. However, Microsoft Excel can also be used if a Google account is not available. The figure below is a screenshot of what Google Sheets looks like with a sine graph plotted. Plotting in spreadsheet programs can be cumbersome but it is possible to do and is a good option for those who are not interested in learning Python or Octave or programming in general. Futhermore, there is a tongue-in-cheek comment from recently graduated engineers that no one knows how to code and everyone just uses Excel. So if that’s the future of engineering, Google Sheets or Excel is the way to go.